- Ethereum is climbing higher and trading nicely above the $130 level against the US Dollar.
- The price is likely to continue higher once it surges above the $150 resistance.
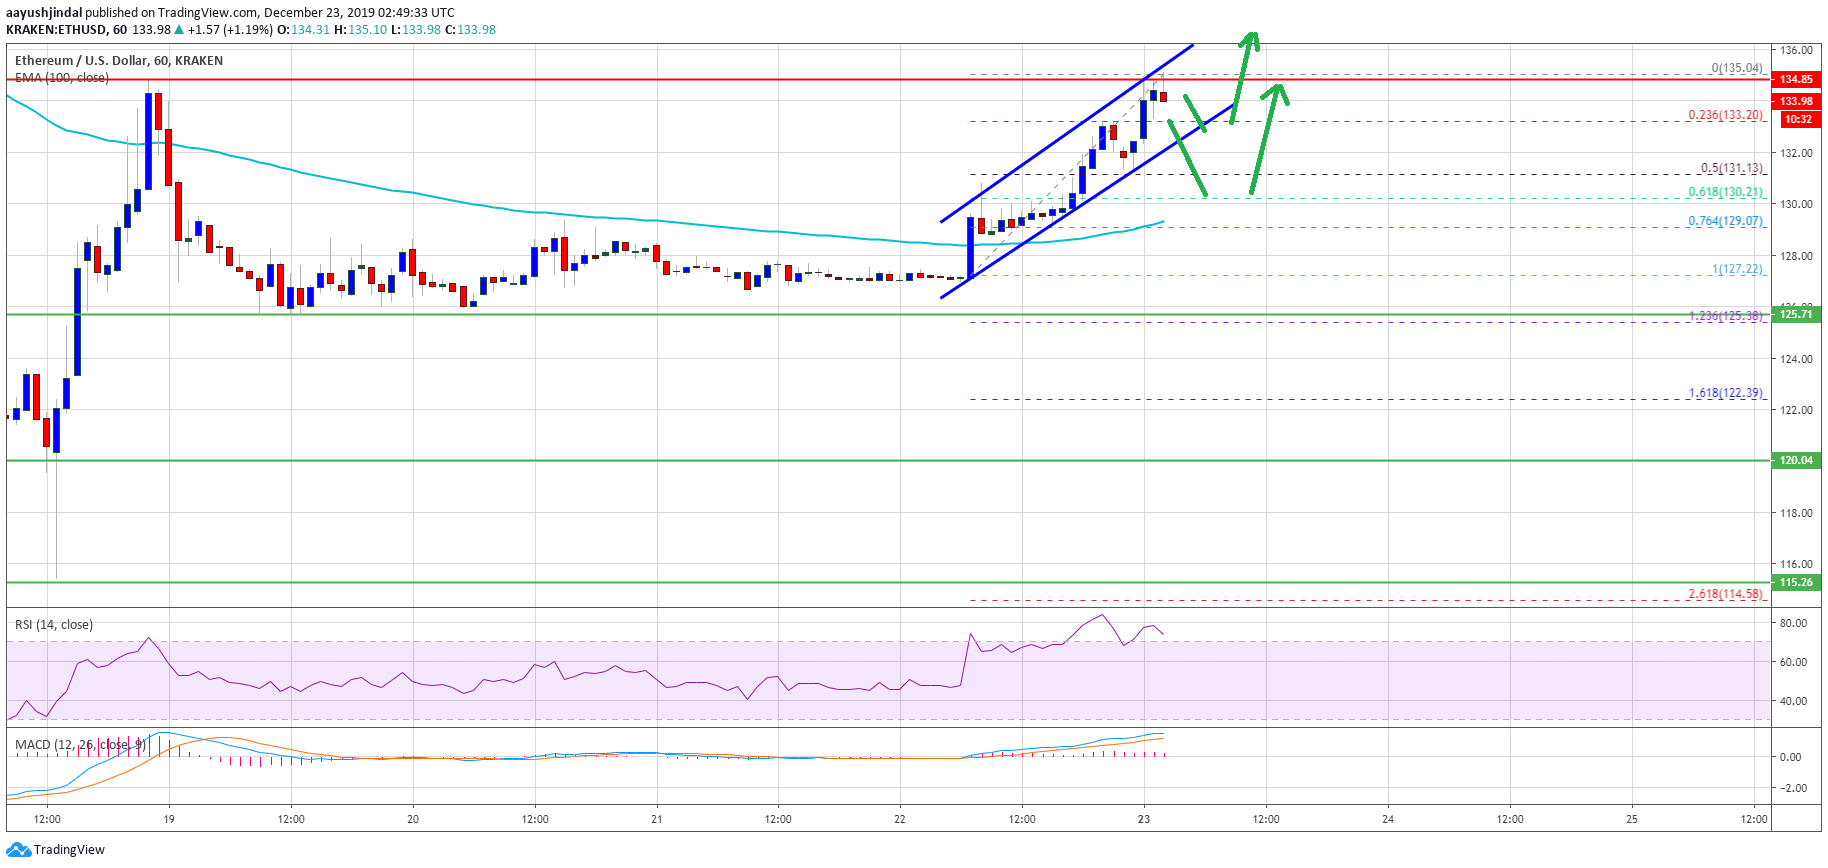
- There is a rising channel forming with support near $133 on the hourly chart of ETH/USD (data feed via Kraken).
- Bitcoin is up more than 5% and it is likely to test $8,000 in the near term.
Ethereum price is gaining bullish momentum versus the US Dollar, and bitcoin rallied above $7,500. ETH price seems to be following an uptrend and it could test $150.
Ethereum Price Analysis
In the weekly forecast, we discussed the chances of more upsides in Ethereum above the $125 level against the US Dollar. ETH price did gain momentum and rallied above the $130 resistance.
Moreover, there was a close above the $130 level the 100 hourly simple moving average. Similarly, bitcoin price surged more than 5% and broke many resistances near $7,500.
Ethereum is also up around 5% and it is trading near the key $135 resistance. If there is a clear break above $135, the price is likely to accelerate towards the $140 and $144 levels. The main target for the bulls could be $150 if there is a clear break and close above $135.
Conversely, there could be a downside correction. An initial support is near the $133 level. Besides, the 23.6% Fib retracement level of the recent wave from the $127 to $135 high it also near $133.
More importantly, there is a rising channel forming with support near $133 on the hourly chart of ETH/USD. Therefore, a downside break below $133 might start an extended downside correction.
The next major support is near the $131 level. Additionally, the 50% Fib retracement level of the recent wave from the $127 to $135 high is at $131. The next major support could be near the $130 level and the 100 hourly simple moving average.
Any further losses may perhaps negate the current bullish view for a run towards the $140 level. In the mentioned case, the price is likely to revisit the main $125 range support in the near term.
Looking at the chart, Ethereum price is showing a lot of positive signs above $130, similar to bitcoin above $7,500. Thus, there are high chances of more gains above $135 and $140. On the other hand, only a close below $125 might start a solid downward move.
ETH Technical Indicators
Hourly MACD – The MACD for ETH/USD is about to move into the bearish zone.
Hourly RSI – The RSI for ETH/USD is now well above the 50 level, with positive signs.
Major Support Level – $131
Major Resistance Level – $135
The post Ethereum (ETH) Shows Signs of Important Reversal, $150 Imminent? appeared first on NewsBTC.

Post a Comment