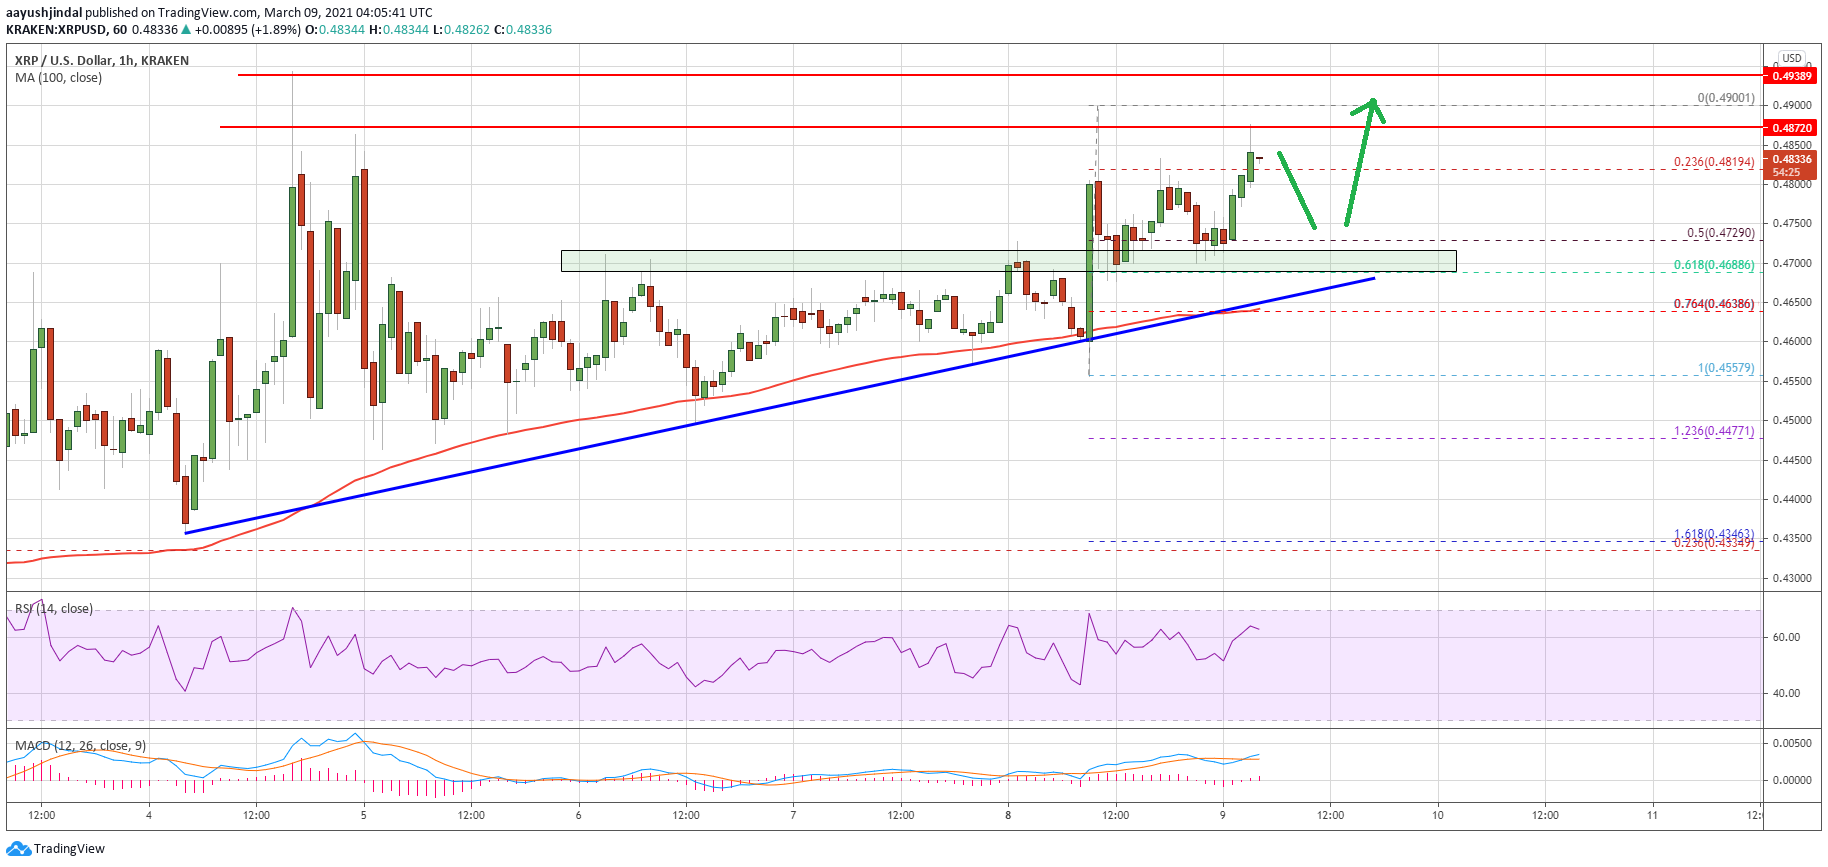
Ripple is consolidating above the key $0.4500 support zone against the US Dollar. XRP price is showing bullish signs and it may soon rally above the $0.5000 resistance.
- Ripple formed a support base above $0.4500 and recovered higher against the US dollar.
- The price is now trading well above the $0.4500 support and the 100 hourly simple moving average.
- There is a major bullish trend line forming with support near $0.4630 on the hourly chart of the XRP/USD pair (data source from Kraken).
- The pair is likely to continue higher above the $0.4880 and $0.5000 resistance levels.
Ripple Price is Showing Positive Signs
In the past 2-3 sessions, there were strong bullish moves in bitcoin and ethereum against the US Dollar. XRP price is also stable and it seems like there is a strong support base forming above the $0.4500 level.
Recently, there was a spike above the $0.4660 resistance. The price even surged above the $0.4800 level, but it failed near $0.4880. As a result, there was a downside correction below the $0.4800 level. The declined below the 23.6% Fib retracement level of the upward move from the $0.4557 swing low to $0.4900 high.
XRP even spiked below $0.4720, but it remained well bid above $0.4620. There is also a major bullish trend line forming with support near $0.4630 on the hourly chart of the XRP/USD pair. The trend line is close to the 50% Fib retracement level of the upward move from the $0.4557 swing low to $0.4900 high.
Source: XRPUSD on TradingView.com
The price is now trading well above the $0.4500 support and the 100 hourly simple moving average. An immediate resistance is near the $0.4880 level. A clear break above $0.4880 will most likely open the doors for a rally above the $0.5000 barrier. The next key resistance could be $0.5500.
Downsides Limited in XRP?
If there is no upside break in ripple above $0.4880 and $0.5000, it could correct lower. An initial support on the downside is near the $0.4720 level.
The main support is near the trend line and $0.4550. A downside break below the trend line and $0.4550 could out a lot of pressure on the bulls in the near term.
Technical Indicators
Hourly MACD – The MACD for XRP/USD is gaining momentum in the bullish zone.
Hourly RSI (Relative Strength Index) – The RSI for XRP/USD is currently well above the 50 level.
Major Support Levels – $0.4720, $0.4600 and $0.4550.
Major Resistance Levels – $0.4880, $0.5000 and $0.5500.

Post a Comment