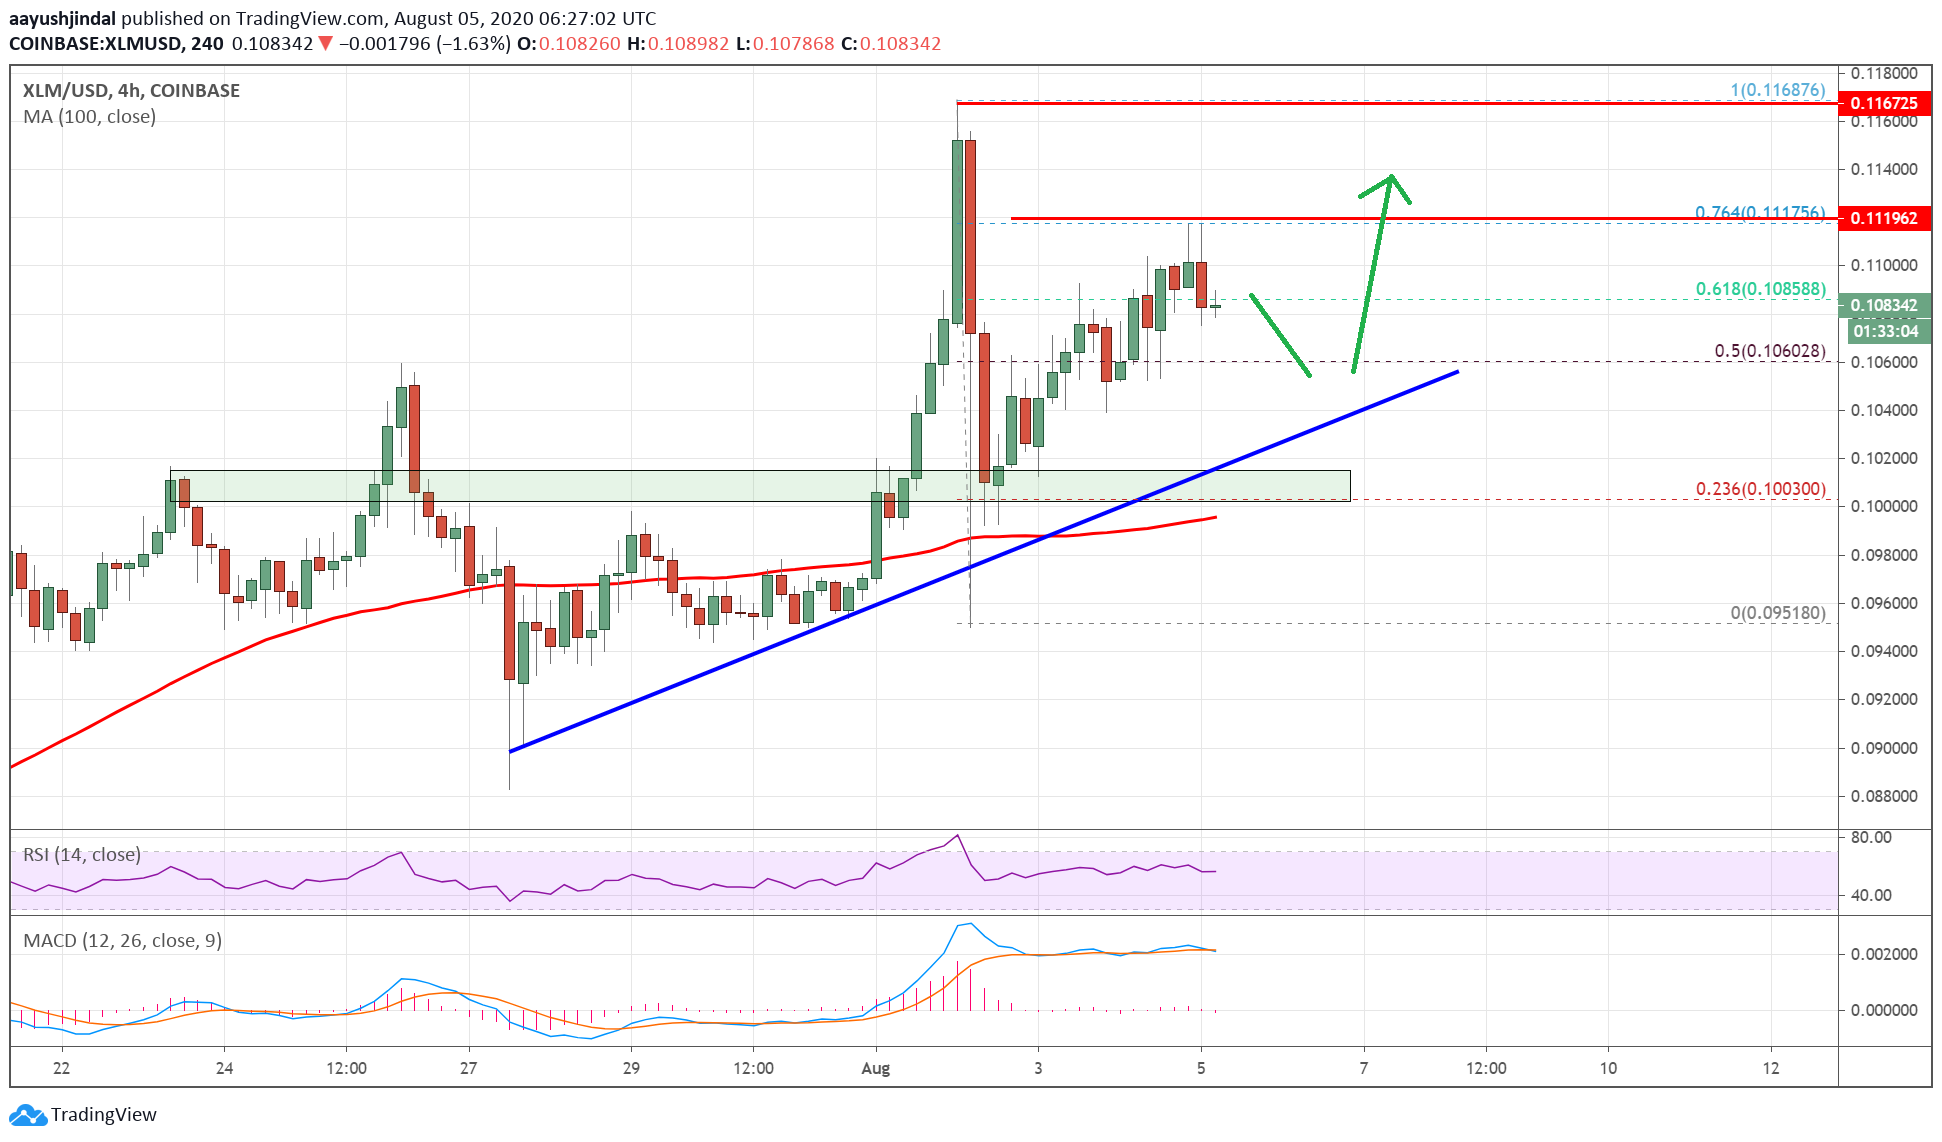
Stellar (XLM) is trading in a bullish zone above the $0.1000 support zone against the US Dollar. XLM price is likely to accelerate towards $0.1200 or even higher if it stays above the $0.1000 support.
- There was a sharp downward move from the $0.1168 monthly high against the US dollar.
- The price found support near the $0.0980 zone and it is currently trading with a bullish angle.
- There is a major bullish trend line forming with support at $0.1040 on the 4-hours chart of the XLM/USD pair (data source from Coinbase).
- The pair is likely to continue higher towards $0.1150 and $0.1200 as long as it is above $0.1000.
Stellar (XLM) is Holding Uptrend
This past week, there was a strong rise in bitcoin, Ethereum and ripple. As a result, stellar (XLM) gained pace above the $0.1000 and $0.1050 resistance levels against the US Dollar. The price even spiked above $0.1100 and it traded as high as $0.1168 before starting a downside correction.
The price dived below the $0.1050 support zone, but the bulls were able to defend the $0.1000 and $0.0980 support levels. A swing low is formed near $0.0951 and the price is currently rising.
There was a break above the $0.1050 level and the price settled well above the 100 simple moving average (4-hours). The bulls pushed the price above the 50% Fib retracement level of the downward move from the $0.1168 high to $0.0951 low.
The price is now facing hurdles near the $0.1120 level. It is close to the 76.4% Fib retracement level of the downward move from the $0.1168 high to $0.0951 low.
Stellar (XLM) price above $0.1050. Source: TradingView.com
It seems like there is a major bullish trend line forming with support at $0.1040 on the 4-hours chart of the XLM/USD pair. On the upside, the bulls need to clear the $0.1120 level for a fresh increase.
A successful break above the $0.1120 resistance could open the doors for more gains towards the $0.1180 and $0.1200 levels in the coming sessions.
Dips Supported in XLM
If XLM price corrects lower, the bulls are likely to protect the $0.1050 level or the bullish trend line. If there is a break below the trend line and $0.1050, the price could extend losses.
The main support is near the $0.1000 level and the 100 simple moving average (4-hours), below which the price might turn bearish in the short-term.
Technical Indicators
4-hours MACD – The MACD for XLM/USD is slowly losing momentum in the bullish zone.
4-hours RSI (Relative Strength Index) – The RSI for XLM/USD is currently well above the 50 level.
Major Support Levels – $0.1050, $0.1040 and $0.1000.
Major Resistance Levels – $0.1120, $0.1180 and $0.1200.

إرسال تعليق