The Ethereum Foundation recently launched the Medalla testnet. This is set to be the final testnet before Ethereum 2.0 goes live into mainnet by the end of the year.
The goal is to test key features in a real working environment to examine its scalability and efficiency.
The news seems to have brought a lot of attention to the smart contracts giant. LunarCRUSH reported that the number of ETH-related mentions on social media exploded since the testnet was launched.
The community analytics firm recorded over 263 million social engagements over the past two days alone.
Despite the hype around ETH 2.0, data reveals that when market participants pay heightened attention to a cryptocurrency, it leads to a steep correction. And a key technical index adds credence to the bearish outlook.
A Correction on Ethereum’s Horizon
TD sequential indicator recently presenting a sell signal on ETH’s 1-day chart. The bearish formation developed as a green nine candlestick. This type of technical pattern estimates a one to four daily candlesticks correction before the uptrend resumes.
Based on historical data, the TD index has been extremely accurate at anticipating Ether’s local tops and bottoms. This index even presented a buy signal on July 18, just before prices surged to a new yearly high of $418.5.
For this reason, the current pessimistic forecast must be taken seriously despite the high levels of interest around the second-largest cryptocurrency by market cap.
TD Presents Bearish Outlook For Ethereum. (Source TradingView.com)
Strong Support Ahead
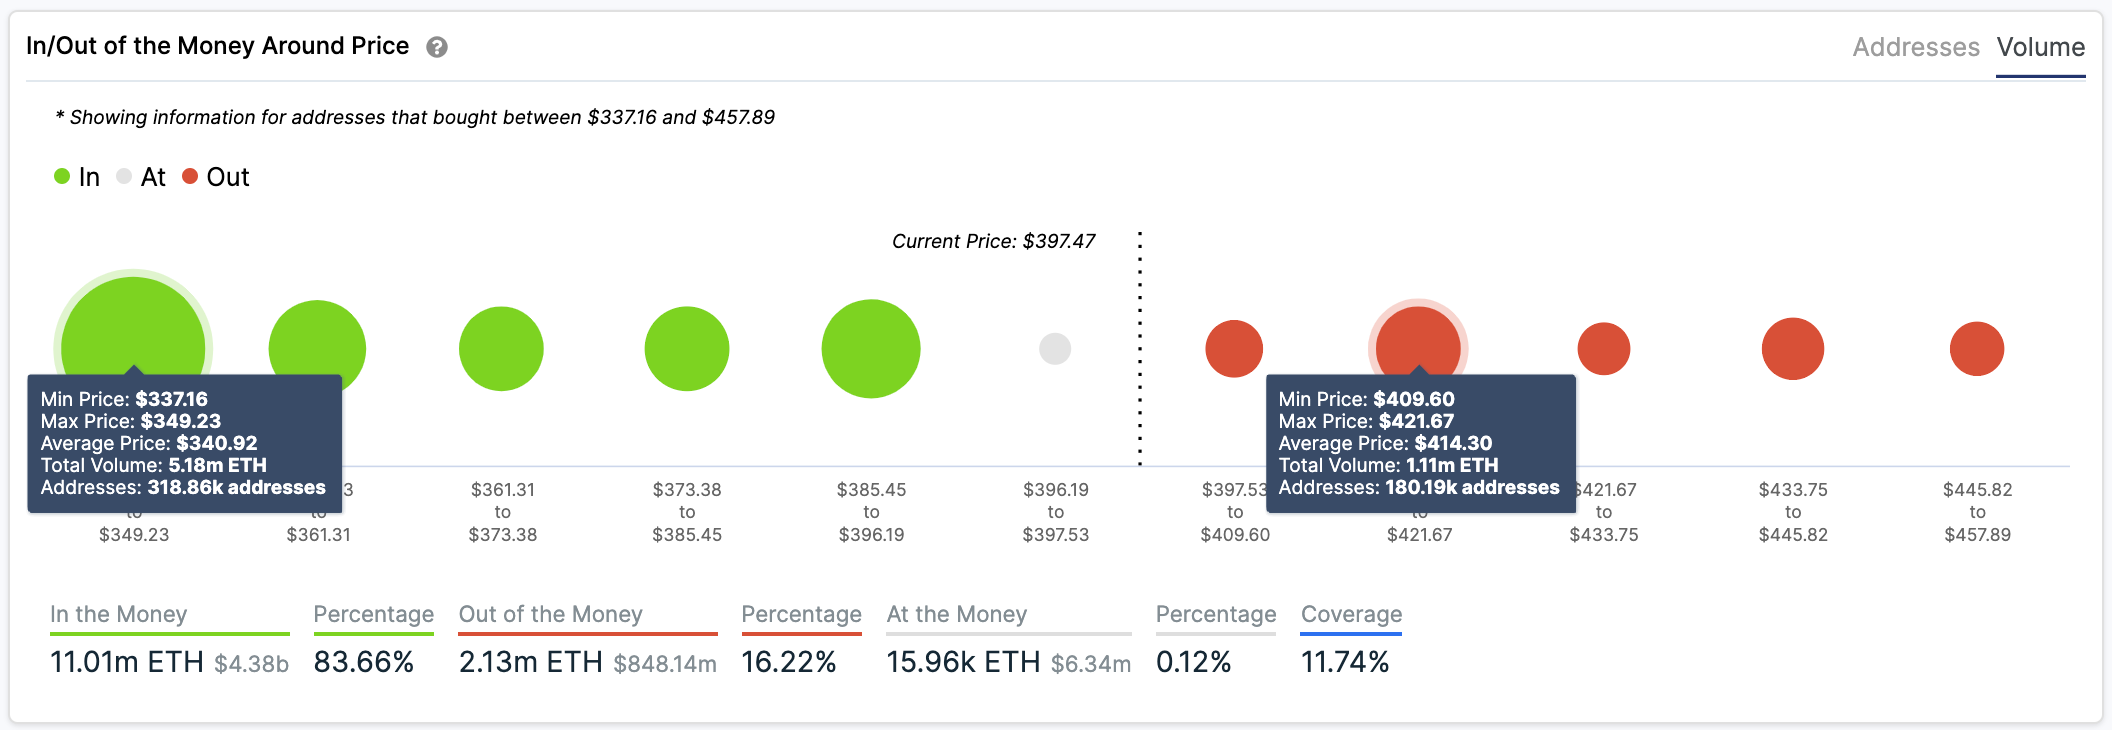
In the event of a correction, IntoTheBlock’s “In/Out of the Money Around Price” (IOMAP) model suggests that the most significant support level underneath Ethereum lies around $341. Here, roughly 320,000 addresses are holding nearly 5.20 million ETH.
Such a massive supply barrier may have the ability to prevent prices from dropping further. Holders within this price range will likely try to remain profitable and may even buy more Ether to allow prices to rebound.

Ethereum's Most Important Support Level Sits Around $341. (Source: IntoTheBlock)
On the flip side, the IOMAP cohorts show that if buy orders continue piling up Ethereum could face stiff resistance around $415. Based on this on-chain metric, approximately 180,000 addresses had previously purchased 1.11 million ETH around this price level.
A sudden spike in demand for the smart contracts giant that allows it to slice through this resistance barrier may see it aim for $500 or higher.
Given the ambiguous outlook and the current state of the market, traders must watch out for the $385 support and the $415 resistance level. Breaking below or above these crucial price point will determine where Ethereum is headed next. A small dose of patience could provide great opportunities to profit from the next major price movement.
Featured Image by Depositphotos
Price tags: ethusd, ethusdt, ethbtc
Chart from TradingView.com
إرسال تعليق