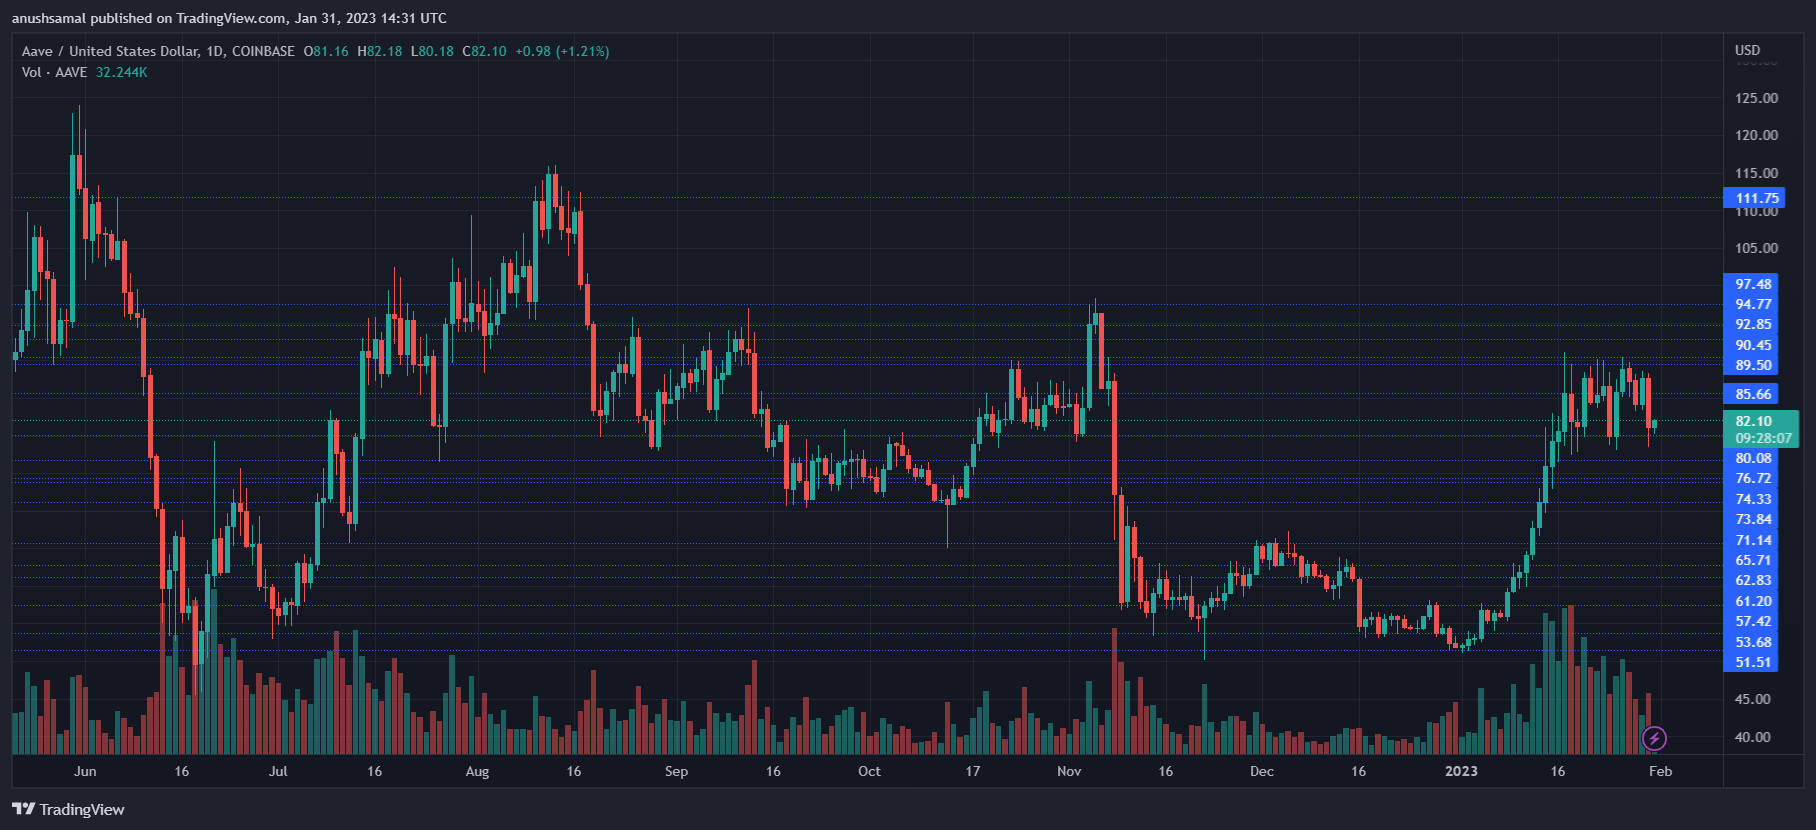
The AAVE price has recovered considerably since the beginning of the month. The coin was hovering around the $50 mark at the beginning of January and breached $90 very recently. It secured close to 70% appreciation.
At the moment, AAVE is trading laterally on its chart. In the last 24 hours, the coin fell by 0.9%, thereby confirming consolidation. The coin started to lose steam as the altcoin failed to cross the $91 price mark. The technical outlook depicted that the coin was still on the bullish side.
After a fall in accumulation over the last few days, the chart noted an uptick in demand at press time. This indicated that AAVE might be eyeing a break in its price consolidation. Over the last two weeks, the coin’s price has fluctuated between $70 and $90, with the altcoin primarily trading above the $84 mark.
The altcoin depicted that the buyers were starting to rise again, which might push demand up and help AAVE break its immediate resistance. At the moment, AAVE is trading 88% below its all-time high secured in 2021.
AAVE Price Analysis: One-Day Chart

Aave was trading at $82 at the time of writing. The journey from $52 to $85 was smooth, after which it took AAVE some time to cross the $90 price level. Over the past few weeks, AAVE has broken past essential resistance levels.
Immediate resistance for the coin stood at $85; a move above that level may help the altcoin reach $90. On the flip side, support for the coin stood at $80 and $76, respectively.
As demand rises, a slight push from buyers will make Aave price challenge $85 and break its consolidation. The amount of Aave traded in the last session was green, indicating an increase in buying pressure.
Technical Analysis

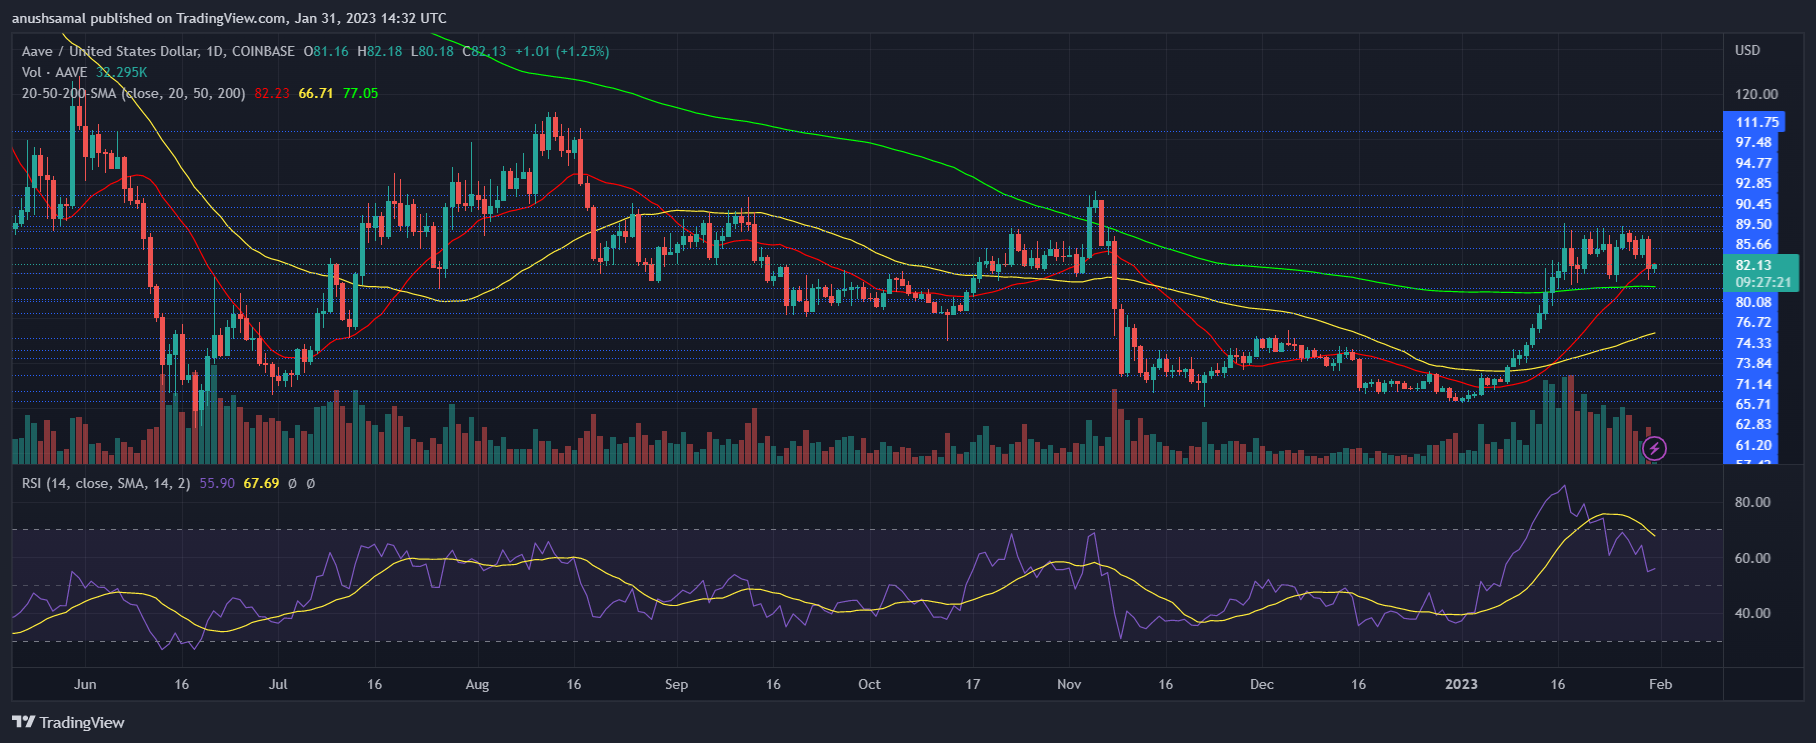
The altcoin visited the overbought zone over the past few weeks; the coin noted a pullback after that, which is not unusual. At the moment, AAVE has started to note an increase in demand. The Relative Strength Index was moving close to the 60 mark, which meant more buyers than sellers.
Accordingly to the increase in demand, the altcoin price moved slightly above the 20-Simple Moving Average (SMA), which suggested that buyers were in charge of the price momentum. The coin was also above the 50-SMA (yellow) and 200-SMA (green) lines, which indicated increased bullishness on the chart.

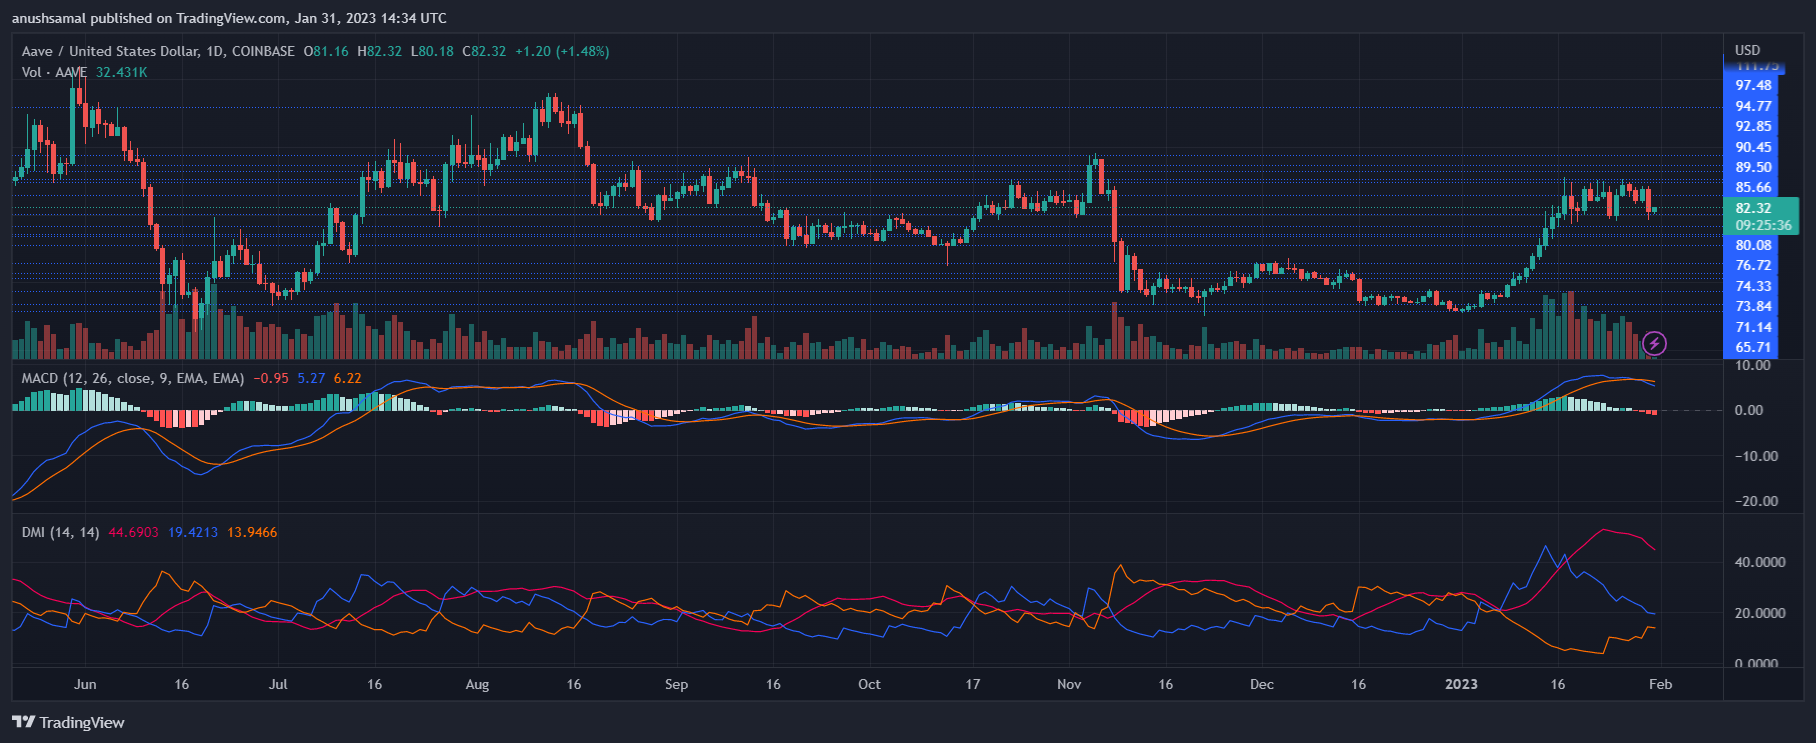
Other technical indicators indicated mixed signals on the one-day chart. The Moving Average Convergence Divergence reads price momentum and change. The indicator formed red signal bars tied to sell signals on the one-day chart.
This could imply that the price will dip in the coming trading sessions before finally breaking through immediate resistance.
The Directional Movement Index was positive, as the +DI line was above the -DI line. The Average Directional Index (red) showed a downward movement, suggesting that the current price trend was weakening.
إرسال تعليق